Healthcare Job Growth Set Records in 2015

John Commins, January 12, 2016

Healthcare jobs accounted for 18% of the 2.6 million new jobs created in the United States in 2015. Coincidentally, healthcare spending represents nearly 18% of the nation’s gross domestic product.

Hospital job growth exploded in 2015, with 172,200 payroll additions reported, a 306% increase over the 42,400 jobs created in 2014, according to the Bureau of Labor Statistics.

Overall, the healthcare sector reported record job growth in 2015, with 474,700 jobs created, which represents a 53% increase over the 309,000 healthcare jobs created in 2014.

To read more: http://www.healthleadersmedia.com/hr/healthcare-job-growth-set-records-2015


Hospitals: Are you marketing to the right audience?

Written by Emily Rappleye | April 27, 2016 | Becker’s Hospital Review

Hospitals and health systems trying to capture a greater portion of their market should take a closer look at their marketing campaigns.

According to a report from Adweek, marketers may be missing an important segment of their audience. Here are three tips from the report on finding that audience and crafting the right message to reach it.

1. Women are the chief healthcare decision makers.
Women are the “chief medical officers” of their families, according to Adweek. It cites a 2015 study from healthcare communications company GreyHealth Group that found women make decisions for their families 94 percent of the time.

“Women lean into healthcare and are typically a more captive audience” than men, TBWAWorldHealth CEO Sharon Callahan said, according to Adweek. “Our goal should be to further fuel and meaningfully tap into this curiosity. Marketers need to respect their knowledge and not operate at the 101 level — but still keep it simple.”

2. Understand what women are looking for.

Read more: http://www.beckershospitalreview.com/hospital-management-administration/hospitals-are-you-marketing-to-the-right-audience.html

2015 PHYSICIAN TOTAL CASH COMPENSATION BY SPECIALTY

Written by Emily Rappleye | September 11, 2015

Primary care physicians this year are experiencing bigger increases in total cash compensation than their specialist peers, according to the 2015 “Physician Compensation and Productivity Survey” from Minneapolis-based Sullivan, Cotter and Associates.

Combined with other findings in the survey, this may suggest the trend toward value-based, coordinated care — which puts primary care physicians in the driver’s seat — could be starting to take hold. According to SullivanCotter, Primary care physicians saw a 3.4 percent median increase in total cash compensation between 2011 and 2015, compared to medical and surgical specialists, who saw 2.5 percent and 2.3 percent increases, respectively.

The table below breaks down median total cash compensation in 2015 by physician specialty and is ranked in order of highest to lowest percent change over last year, as presented by SullivanCotter. The information is based on data from 560 organizations and nearly 115,000 physicians and advanced practice clinicians.

12KK

http://www.beckershospitalreview.com/compensation-issues/2015-physician-total-cash-compensation-by-specialty.html

BABY BOOMERS ARE OPENING THEIR WALLETS

Baby boomers are often portrayed in the popular press as a monolithic group of individuals who behave in roughly the same ways and possess the same attitudes. But do these observations hold for all boomers? Or are they emblematic of just some?
Recent Gallup analysis of boomers’ personal spending patterns suggests that these patterns vary more than stereotypes suggest. These differences matter most to marketers who hope that boomers are finally re-opening their wallets after the global financial crisis and will spend some of their discretionary income with their companies.

chart1

The global financial crisis hit baby boomers particularly hard. According to Gallup Daily tracking research, self-reported daily spending among Americans aged 50 to 64 years old (roughly the ages of the baby boomer cohort) reached a low of $55 in March 2009. About one year earlier (February 2008), daily spending in this group had been at $114. By last December, this cohort’s daily spending had rebounded to a five-year high of $105 per day. Nonetheless, the trend suggests that the daily spending among boomers has been increasing since bottoming out in 2009. But exactly what are they spending more on?

Gallup research conducted last spring revealed that while 45% of U.S. consumers reported that they were spending more than a year ago, their increased spending was on household essentials, including groceries, gasoline, utilities and healthcare rather than on discretionary purchases such as travel, dining out, leisure activities, consumer electronics and clothing. About four in 10 baby boomers (44%) in that same study reported that they were spending more than a year ago, and their increased spending followed the same pattern — more on things they need, not on things they want.

According to demographers, there are really two different cohorts of baby boomers. “Leading-edge” boomers were born between 1946 and 1955 and came of age during the tumultuous Vietnam War and Civil Rights eras. “Trailing-edge” boomers were born between 1956 and 1964 and came of age after Vietnam and the Watergate scandal.

In general, a higher proportion of leading-edge baby boomers report that they are spending more today than a year ago compared with trailing-edge boomers. Net spending change — defined as the percentage of consumers indicating that they are spending more today than a year ago minus the percentage saying they are spending less — is positive for leading-edge boomers but negative for trailing-edge boomers. This 23-percentage-point gap between the cohorts means that more leading-edge (older) boomers are spending more overall and more trailing-edge (younger) boomers are spending less.

chart2

For the full article click here.

HOSPITALS ADD NEARLY 18K JOBS IN OCTOBER

The healthcare industry added 44,900 jobs last month, contributing to the nation’s 271,000 new jobs in October, according to the most recent jobs report from the Bureau of Labor Statistics.

This is an increase from September’s numbers, when healthcare added 34,400 jobs. Over the past year, healthcare has added 495,000 jobs.

Within the healthcare industry, hospital employment grew by 17,800 jobs in October. However, ambulatory healthcare services added the most, with 26,900 jobs. Most of those came from physician offices (8,300) but outpatient care centers (1,700) and home healthcare services (8,100) also contributed.

Written by Kelly Gooch | November 06, 2015

http://www.beckershospitalreview.com/workforce-labor-management/hospitals-add-nearly-18k-jobs-in-october.html

Baby Boomers Are Opening Their Wallets

Baby boomers are often portrayed in the popular press as a monolithic group of individuals who behave in roughly the same ways and possess the same attitudes. But do these observations hold for all boomers? Or are they emblematic of just some?

Recent Gallup analysis of boomers’ personal spending patterns suggests that these patterns vary more than stereotypes suggest. These differences matter most to marketers who hope that boomers are finally re-opening their wallets after the global financial crisis and will spend some of their discretionary income with their companies.

Graph for Baby Boomers

The global financial crisis hit baby boomers particularly hard. According to Gallup Daily tracking research, self-reported daily spending among Americans aged 50 to 64 years old (roughly the ages of the baby boomer cohort) reached a low of $55 in March 2009. About one year earlier (February 2008), daily spending in this group had been at $114. By last December, this cohort’s daily spending had rebounded to a five-year high of $105 per day. Nonetheless, the trend suggests that the daily spending among boomers has been increasing since bottoming out in 2009. But exactly what are they spending more on?

Gallup research conducted last spring revealed that while 45% of U.S. consumers reported that they were spending more than a year ago, their increased spending was on household essentials, including groceries, gasoline, utilities and healthcare rather than on discretionary purchases such as travel, dining out, leisure activities, consumer electronics and clothing. About four in 10 baby boomers (44%) in that same study reported that they were spending more than a year ago, and their increased spending followed the same pattern — more on things they need, not on things they want.

According to demographers, there are really two different cohorts of baby boomers. “Leading-edge” boomers were born between 1946 and 1955 and came of age during the tumultuous Vietnam War and Civil Rights eras. “Trailing-edge” boomers were born between 1956 and 1964 and came of age after Vietnam and the Watergate scandal.

Leading-Edge Boomers Spend More Than Trailing-Edge Boomers

In general, a higher proportion of leading-edge baby boomers report that they are spending more today than a year ago compared with trailing-edge boomers. Net spending change — defined as the percentage of consumers indicating that they are spending more today than a year ago minus the percentage saying they are spending less — is positive for leading-edge boomers but negative for trailing-edge boomers. This 23-percentage-point gap between the cohorts means that more leading-edge (older) boomers are spending more overall and more trailing-edge (younger) boomers are spending less.

Graph 2

For the full article click here.

More Print Ad Declines Coming

Last year was bad for print and this year won’t be much better, according to the Advertising Consensus Forecast from the World Advertising Research Center, which predicts further declines for both magazines and newspapers in the U.S. in 2013-2014.

Following a 4% decline in 2012, the WARC forecast sees U.S. magazine ad spending decreasing 4% in 2013 and 5.1% in 2014. That prediction looks rosy compared to WARC’s forecast for U.S. newspapers, where ad spending will fall 6.7% in 2013 and 8.4% in 2014. WARC estimates that U.S. newspaper ad revenues fell 7.2% in 2012.

U.S. newspapers’ ad revenues have declined every year since 2006, according to the Newspaper Association of America, tumbling from $49.4 billion in 2005 to $23.9 billion in 2011, the latest year for which full figures are available from the NAA. Combining the NAA figures with WARC’s forecast, total newspaper ad revenues will continue to drop from around $22.2 billion in 2012 to $20.7 billion in 2013 and $19 billion in 2014.

Meanwhile, according to the Publishers Information Bureau total magazine ad revenues (based on official rate cards) have declined from $27.5 billion in 2007 to about $21.1 billion in 2012. Combining these figures with the WARC forecast, revenues will sink to $20.3 billion in 2013 and $19.2 billion in 2014.

A separate forecast released by eMarketer in September sees smaller decreases in U.S. magazines’ print ad revenue over the next few years, with drops of 0.4% and 0.3% in 2013 and 2014, respectively. The consultancy estimated U.S. magazines’ total print ad revenues at around $15.2 billion in 2012. The same forecast has newspapers’ print ad revenues declining 6.1% in 2013 and 4% in 2014, to about $17.3 billion.

Read the Full Article at Mediapost.com

Global Internet Ad Spend Sees Double-Digit Growth, Outpaces Other Media

stats
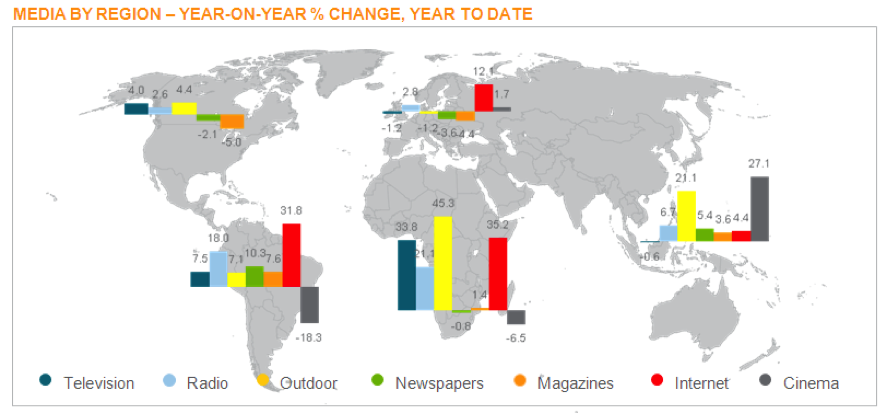
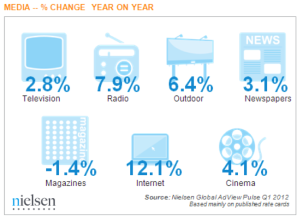
With consumer confidence up and brands looking to reconnect, spending on advertising is on the rise—around the globe and across media types. TV, newspapers, radio, outdoor, Internet, and cinema all saw an increase in ad spend in the beginning of 2012 compared to last year, according to Nielsen’s quarterly Global AdView Pulse report. Though TV continues to attract the majority of advertising dollars, Internet advertising saw the biggest increases, with advertisers spending 12.1 percent more in Q1 2012 than one year prior. During that time, ad spend overall increased 3.1 percent globally.

Across the regions, the findings are markedly different as each media has taken root and evolved uniquely.

Television
Dollars devoted to TV advertising grew 4 percent in North America, second only to outdoor, and 7.5 percent in Latin America. In the Middle East and Africa, TV ad spend grew a whopping 33.8 percent.

Internet
Online ad spend was a bright spot for the industry, with growth around the globe. Growth was particularly notable in Europe (12.1%), Latin America (31.8%) and the Middle East & Africa (35.2%).

Print (Magazines and Newspapers)
Magazines saw a minor decline compared to last year, but newspapers grew 3.1 percent. In Latin America and Asia Pacific, both media grew—7.6 percent and 10.3 percent, respectively in Latin America, and 3.6 percent and 5.4 percent, respectively in Asia Pacific. North America saw nominal declines in print ad spend.

Radio
Radio saw increases in every region around the globe, including a 2.6 percent increase in North America and 2.8 percent in Europe. In emerging markets in Latin America and Middle East and Africa, those increases were much higher. Radio grew 18 percent in Latin America and 21.1 percent in the Middle East and Africa.

Cinema
In Asia Pacific, cinema grew 27.1 percent, offsetting the declines seen in Latin America and the Middle East and Africa.

Outdoor
Still a nascent industry, outdoor is growing rapidly. In the past quarter, outdoor ad spend increased 6.4 percent globally. This included gains of 4.4 percent in North America, 45.3 percent in the Middle East and Africa and 21.1 percent in Asia Pacific. Only Europe experienced a decline (1.2%).

map

Methodology
The external data sources for the other countries included in the report are:

  • Argentina: IBOPE
  • Brazil: IBOPE
  • Croatia: Nielsen in association with Ipsos
  • Egypt: PARC (Pan Arab Research Centre)
  • France: Yacast
  • Greece: Media Services
  • Hong Kong: admanGo
  • Japan: Nihon Daily Tsushinsha
  • Kuwait: PARC (Pan Arab Research Centre)
  • Lebanon: PARC (Pan Arab Research Centre)
  • Mexico: IBOPE
  • Pan-Arab Media: PARC (Pan Arab Research Centre)
  • Portugal: Mediamonitor
  • Saudi Arabia: PARC (Pan Arab Research Centre)
  • Spain: Arce Media
  • Switzerland: Nielsen in association with Media Focus
  • UAE: PARC (Pan Arab Research Centre)

Read the Full Article at Nielsen.com

LI Hospitals Up Their Dosage of Advertising

— Although physicians rarely make house calls and health care providers face declining reimbursements, Long Island hospitals are making a rush to residents’ homes with advertising ranging from TV to radio and from outdoor media to the Web.

They’re snapping up full-page print ads, radio spots during drive time and TV spots that tug at the heartstrings, a bright spot in an otherwise anemic advertising market.

They’re also buying billboards at Long Island Rail Road stations, Long Island Ducks games and the Nassau Coliseum.

The ad spending binge is a bid to capture share of mind in a crowded field of nearly 30 Long Island institutions.

Bill Daddi, a spokesman for Kantar Media, which tracks health care advertising spending, said hospitals, clinics and medical centers in the New York metropolitan area spent $69 million in 2010, up from $66 million 2009. They spent $19.8 million in the first quarter of 2011, up from $15.4 million a year ago.

The North Shore-Long Island Jewish Health System is in the midst of its “biggest campaign yet,” said Don Simon, the system’s vice president of marketing.

“Health care is moving to a consumer orientation where consumers have a greater say in the choice of health care providers. They’re seeking more information,” Simon said. “As a lot of health plans increase deductibles, consumers are being more careful about how they spend their health care dollars.”

While North Shore-LIJ hits home with its “Hope Lives Here” campaign, Winthrop-University Hospital in Mineola has been flexing its marketing muscles with a campaign touting “Your health means everything.”

“We’re spending a bit more than last year,” said Ed Keating, Winthrop’s vice president of marketing, advertising and public relations. “It’s become a much more competitive market, especially in the greater New York metropolitan area.”

Hospitals say they’re spending to build customer loyalty and avoid losing revenue, which would be a one-two punch as reimbursements drop.

“Our goal is twofold,” Simon said. “To create an emotional connection with potential patients as well as provide the community with health care information that will help them make a good health care decision.”

Keating said hospitals need to market or risk being marginalized.

“Left to themselves, people will think of you what they want,” he said. “It’s important to us to make people aware of the excellent medical services we have.”

Although hospital advertising runs the gamut, providers are investing more in Internet campaigns than in the past.

“We know that the Internet is playing an increasing role in how people educate themselves about medical care,” Keating said. “Eight in 10 Internet users have looked online for health information.”

Simon said North Shore-LIJ is using interactive digital banners and linking consumers to information about service such as orthopedics, doctor lists and videos.

“Health care is one of the highest searched areas on Google,” Simon said. “Patients and caregivers are going online to access information that helps them make health care decisions.”

Winthrop positions itself as a big institution amid a sea of smaller Long Island hospitals. Only North Shore University Hospital at Manhasset is larger.

“We’re in the process of changing the perception of Winthrop,” Keating said of the 591-bed institution. “We’re not a small hospital.”

In addition to vying with one another, Long Island hospitals are seeking to dissuade Long Island patients from going to New York City hospitals. Eighteen percent of patients from Nassau County in 2008 went to hospitals elsewhere, primarily New York City.

“Any hospital is trying to do that,” said Janine Logan, a spokeswoman for the Nassau-Suffolk Hospital Council. “We want to avoid the outmigration to New York City hospitals. We’ve got stellar facilities here.”

Winthrop’s Keating said the proof of the wisdom of marketing is in the profits, as good medicine, marketing and reputation keep the hospital healthy.

“It’s working,” he said. “We’re getting great feedback from the community and doctors. We have increased referrals and business, which is the most important thing. Our business is strong.”

Read the Full Post at Long Island Business News

Ad Spending Increases Again, Report Finds

Advertising spending is continuing to recover from the recession and financial crisis, according to a report released Monday morning, although the rate of growth is slowing.

The report, by Kantar Media, part of WPP, found that ad spending in major media in the United States in the first quarter rose 4.4 percent from the same quarter a year ago. The percentage gain is the fifth quarterly increase in a row since the end of 2009, but it is the smallest of the five.

That is not necessarily a red flag, according to Kantar. As the bounceback from hard times goes on, the quarterly results are up against tougher comparisons versus the previous year.

“We’re now comparing against stronger numbers from a year ago,” said Jon Swallen, senior vice president for research at the Kantar Media Intelligence North America unit of Kantar.

“A year and a half into a recovery, that’s not an unusual pattern to see stronger growth at the outset,” he said.

Another signal that Madison Avenue may not need to be anxious is that “we’re seeing growth across a very broad spectrum of advertisers,” Mr. Swallen said.

“More than two-thirds of advertisers are increasing budgets compared with a year ago,” he added.

The 4.4 percent increase in the first quarter comes after the four consecutive quarterly gains in 2010 compared with the same periods of 2009: 7 percent in the fourth quarter, 8.7 percent in the third quarter, 5.4 percent in the second quarter and 5.1 percent in the first quarter.

Although most advertisers are continuing to spend more, they are still shying from newspapers and newspaper-related media, the Kantar report shows.

Of the seven categories of media tracked in the first quarter, only two were down from the same period a year ago: newspapers, down 2.1 percent, and free-standing inserts, mostly distributed through newspapers, down 17.5 percent.

Within the newspaper category, ads in local newspapers declined 1.1 percent. It was the 22nd consecutive quarter of negative results, Kantar said.

Ads in national newspapers fell 7.5 percent compared with the first quarter of 2010, according to the report, and ads in Spanish-language papers declined 7.4 percent.

The media category with the largest percentage gain was Internet display ads, up 14.6 percent, followed by outdoor ads, up 12.5 percent; television, up 5.3 percent; and magazines, up 4.5 percent.

The media subcategory with the biggest percentage increase was cable television, up 31.9 percent, followed by Spanish-language magazines, up 22.3 percent.

Turning to ad spending by categories of advertisers, there were gains in eight of 10 categories in the first quarter, just as there was in the fourth quarter of 2010.

The category with the biggest increase was insurance, up 29 percent, reflecting the intense competition among auto insurers.

Insurance was, appropriately, followed by automotive, up 23 percent. (Automotive is the largest ad category of all.) Within the auto category, ad spending by automakers climbed 24.2 percent, the report said, and ad spending by auto dealers rose 20.6 percent.

The increases for auto ad spending are “beginning to slow down just a little bit,” Mr. Swallen said, “and we see that extending into the beginning of the second quarter as well.”

Some of the slowdown was related to the effects of the Japan earthquake and tsunami on supplies of cars made in Japan, he added.

As for the advertisers that spend all the money, Procter & Gamble led the list of the top 10, as it often does. Procter spent $719.8 million in the first quarter, the report said, down 5.9 percent from $765 million spent in the first quarter of last year.

Of the top 10 spenders, seven spent more than they did a year ago. They include the Chrysler Group, up 58.6 percent; Toyota Motor, up 30.3 percent; Ford Motor, up 27.3 percent; L’Oreal, up 14.1 percent; AT&T, up 6.9 percent; and General Motors, up 1.3 percent.

Another bigger spender, the Comcast Corporation, has a virtual asterisk next to its name.

Comcast’s ad spending rose 47.7 percent, vaulting the company into the top 10, because of its acquisition of NBCUniversal. The ad spending for Universal movies and other NBCUniversal properties is now added to Comcast’s totals.

The other decliners in the top 10, in addition to Procter, were Verizon Communications, down 24.4 percent, and Pfizer, down 11.1 percent.

The top 10, in descending order of total first-quarter spending, are: Procter, AT&T, General Motors, Comcast, Verizon, Pfizer, Chrysler, Toyota, Ford and L’Oreal.

The Kantar top 10 list pretty much matches the top 10 list that has been compiled by a Kantar competitor, Nielsen. The Nielsen list of top 10 ad spenders in the first quarter, also in descending order, is: Procter, AT&T, General Motors, Toyota, Ford, Comcast, Chrysler, Pfizer, Verizon and Honda Motor.

And like Kantar, Nielsen’s numbers show that among the major media categories, ad spending declined in the first quarter in only one, newspapers, by 10 percent.

Read the Full Article on The New York Times Website

Do We Have Your Attention?  Find Out More About Working with Innovare